
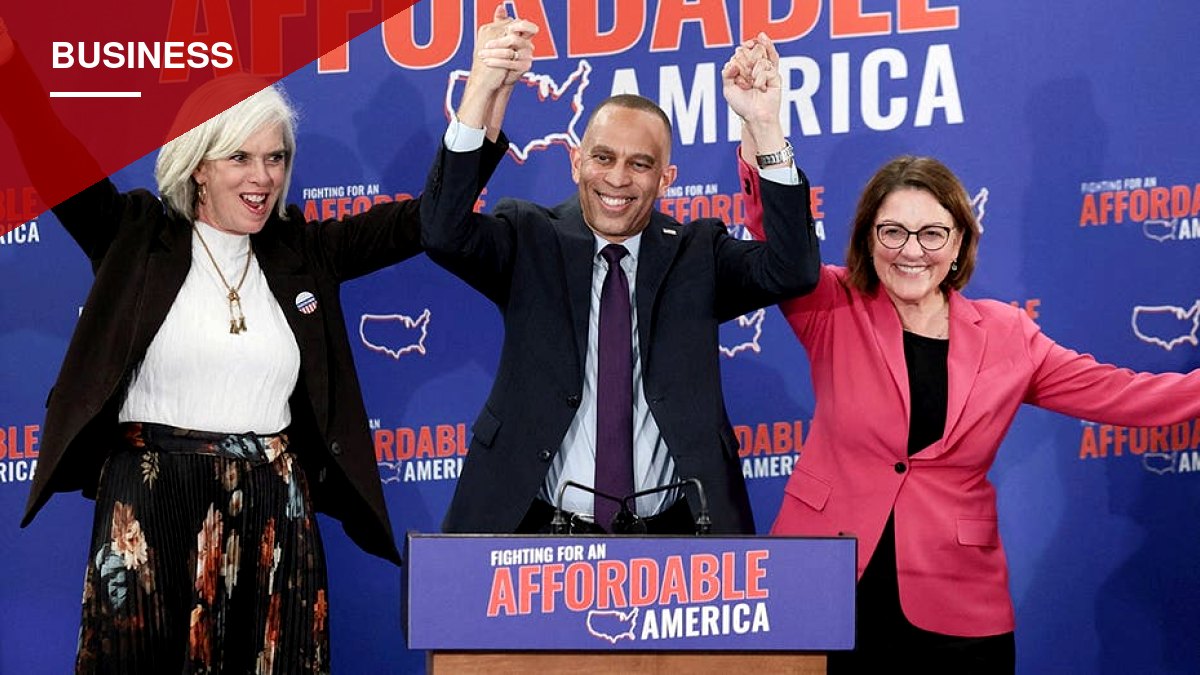

With Democrats now in control of the House and Senate while Donald Trump remains in the White House, many investors are asking what the shift in power might mean for their retirement accounts. Financial commentator Ted Jenkin says the answer is less dramatic than the political mood suggests, pointing to decades of market data rather than headlines.
According to research from RBC Wealth Management and Bloomberg covering 1953 through 2025, the S&P 500 has historically averaged just 4.9% annually under the specific configuration of a Republican president paired with a Democratic-controlled House and Senate. That figure is the lowest average among six political arrangements studied over that period. The numbers reflect historical annual price returns and exclude dividends; they are not a forecast for 2027.
A separate statistic offers a more encouraging signal. Capital Group data shows the S&P 500 has averaged a 15.4% gain in the 12 months following midterm elections since 1950, and notably, every post-midterm 12-month period in that study produced a positive return.
Why markets react this way
One widely cited explanation is that markets dislike uncertainty more than they dislike any particular outcome. Once an election result is known, some of the uncertainty that weighed on investor decisions during the campaign tends to lift, even if the result itself isn’t popular with every investor.
Divided government, with Trump in the White House and Democrats controlling Congress, generally makes passing major legislation harder. Tax changes require negotiation, spending bills can turn into political fights, and the risk of government shutdowns or debt-ceiling standoffs can create its own uncertainty. Some investors see reduced odds of sweeping policy change as a positive; others worry that gridlock will leave serious fiscal problems unaddressed.
What actually moves markets
Jenkin cautions that historical averages tied to congressional control don’t prove that control caused those returns. He points to several factors that matter more directly for long-term portfolio performance:
- Corporate earnings, which can support stock prices regardless of who holds Congress
- Interest rate decisions from the Federal Reserve and the path of inflation
- The likelihood of major tax changes to corporate, capital gains or individual income taxes, which face steep political hurdles under divided government
- Government spending and debt levels, with the national debt standing above $40 trillion, which can affect Treasury yields, borrowing costs and investor confidence
Jenkin argues that one of the most common mistakes investors make is letting political disappointment dictate financial decisions — selling stocks because they dislike the president, or shifting into cash because they dislike Congress, then waiting for a political outcome that feels more comfortable before reinvesting.
He stresses that a 4.9% historical average does not guarantee a 2027 return of that size, just as the 15.4% post-midterm average is not a promise of a rally.






You must be logged in to post a comment Login